The Northrop Grumman Advanced Technology and Development
Center beamline consists of an RF driven ion source and double
solenoid LEBT, a 1.013 MeV electroformed RFQ, a matching section
(MS) bunching cavity, a 1.76 MeV DTL, and a HEBT designed to deliver
a 10 mA H+ beam to a prototype contraband detection system (CDS)
target .We have characterized the beam phase space in the LEBT,
at the RFQ output, MS output, and DTL/HEBT output as a function
of ion source, LEBT, RF cavity and HEBT parameters with a pair
of electrostatic sweep emittance scanners. The beamline transmission
was measured with Faraday cups and toroids. The beam intensity
distribution incident on a CDS test target was obtained from radiometric
surface temperature measurements of the target with a scanning
HgCdTe infrared detector. In this paper we will discuss the performance
and operational characteristics of this beamline and present data
on beam characteristics for nominal and off nominal RF cavity
operation.
The Northrop Grumman 1.76 MeV beamline was designed as a test bed for H- and H+ beam transport measurements, RF accelerating cavity characterization and development of beam diagnostics and computer controls. The key features of the beamline are a 7 cm RF driven multicusp ion source, a double solenoid LEBT, a four vane RFQ, a matching section (MS) cavity, a 9 gap DTL, a HEBT consisting of three emq's, and a target station and diagnostic box. The details of the beamline layout are shown in ref. [1].
An output energy of 1.76 MeV was chosen to complement our target development program for a contraband detection system (CDS) machine employing gamma resonance absorption, and utilizing a 1.76 MeV electrostatic tandem accelerator [2].
Optimum beamline performance is obtained by appropriate LEBT and rf cavity design. In order to optimize and understand the system performance a thorough experimental characterization is necessary. Many of the beamline parameters cannot be set a priori to the design values. Variation in the rf input power and the cavity phasing as well as the focusing lenses, can be used to optimize the beam transport.
In this paper we will present measurements of the
beamline transmission as a function of the beam current and RF
cavity parameters, measurements of the beam emittance at several
points in the accelerator, and beam intensity distributions obtained
by fast radiometric measurements from a prototype CDS target.
The dependence of the transported current through the LEBT, RFQ and MS combination, and DTL, on the ion source output current is shown in figure 1. Current toroids are located at the ion source output, rfq input, DTL input, and after the emq HEBT. For these measurements all of the LEBT parameters, rf cavity parameters (input power and rf phase), and HEBT emq settings were held constant. Only the ion source input power was varied. Also shown in this figure is the H+ emittance measured after the first solenoid in the LEBT.
Over the range of source output currents the H+ beam fraction varies from 60% to 80%. The double solenoid LEBT is designed to focus only the H+ beam into the rfq entrance while the H2+ and H3+ beams remain divergent. Since the rfq input current is measured with a toroid located at the rfq entrance flange there is a small contribution to this current from the on axis H2 and H3 components.

The LEBT emittance is a function of the total ion source output current via the perveance match to the extraction optics, and it is also a function of the LEBT solenoid settings. Independent measurements of the rfq transmission show that transmission remains constant at approximately 65% for rfq powers between 70 kW and 90 kW and output currents from 0 to 25 mA. The data in fig. 1 shows that the combined MS and RFQ transmission slowly decreases from 0.65 to 0.5 indicating that the MS transmission varies from approximately 100% to 85% as the output current is increased.
The combined DTL and HEBT transmission remains constant at approximately 98% over the measurement range. The data shown in fig. 1 were optimized for a 15 mA rfq output current. By re-optimizing the LEBT we have transported 25 mA through the rfq.
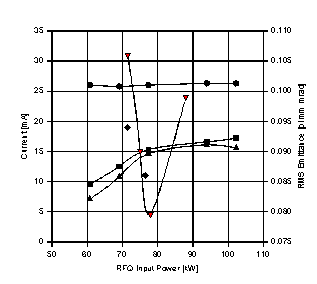
We believe that the decrease in RFQ transmission at higher source output currents is primarily due to the rapid rise in the LEBT emittance and the inability to properly match the ion source output beam to the RFQ acceptance.Variation of the rfq input power has a significant effect on the transported current and beam emittance.. These results are shown in fig. 2. The rfq nominal design power is 67 kW with a vane tip voltage of 44 kV. At the design value the rfq transmission is approximately 47 %, and increases to 64% at 100 kW corresponding to a 22% increase in the vane tip voltage. The knee in the curves shown in fig. 2 corresponds with the minimum rfq output emittance.
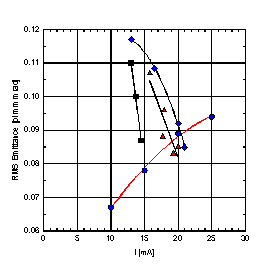
Horizontal emittances were measured at the rfq output, and the MS output as a function of the output current. These results are shown in figure 3. Initially emittance measurements at the MS output were made with no rf power applied to the cavity. This results in no longitudinal bunching, and only transverse focusing via the three pmq's located in the cavity.
From fig. 1 we see that the input beam emittance is approximately 0.08 mm mrad at 10 mA rfq output and increases rapidly to greater than 0.18 mm mrad for output currents greater than 17 mA. The rfq output emittance however varies from 0.068 mm mrad to 0.095 mm mrad over this same range and shows that the rfq filters the output emittance via transmission losses of high emittance particles. The matching section data shows a strong dependence on the output current and some emittance growth of the rfq output beam at currents below 20 mA.
For optimum DTL performance both the MS and DTL must be correctly phased. The MS phase must be set to bunch the beam longitudinally without acceleration, and the DTL must be phased to correspond with the 34 deg synchronous phase of the rfq output beam. Since we are not set up to perform any longitudinal beam characterization we must rely only on transverse emittance and transmission measurements to optimize the beamline performance and use the cavity phase as an adjustable parameter.
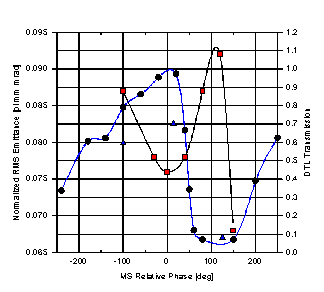
When power was applied to the MS cavity the MS output emittance was measured as a function of the relative rf phase between the MS and the rfq. After the DTL was installed the DTL transmission was also measured as a function of the MS cavity phase. This data is shown in fig. 4. The MS emittance was measured at 10 mA, and the DTL transmission was measured at 6 10 and 16 mA and was found to be independent of current. The results show clearly that the maximum DTL transmission is obtained at the minimum MS output emittance. Furthermore both measurements show a sinusoidal like variation with phase with some evidence of 360 degree periodicity. Based on this data we have chosen a MS operating point at -20 deg.
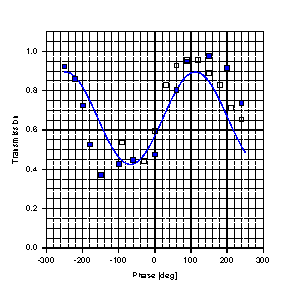
A similar transmission measurement was performed with variation of the DTL relative phase. These results are shown in fig. 5. The solid line shows the least squares fit of the 16 mA data to a cosine function. Based on these results we have chosen dtl = +90 deg as the DTL operating point.
Beam emittance measurements at 10 mA in the downstream diagnostic box with ms = - 20 deg, and dtl = +90 deg show that x = 0.100 mm mrad, and y = 0.155 mm mrad.
The results of TOPKARK [3] simulations of the DTL
output beam indicate that the x emittance increases by 29%, and
the y emittance increases by 125% at the DTL output. If we take
our effective MS output emittance as eff = (xy)
= 0.076 mm mrad then our data shows a 39% increase in the x emittance
and a 122 % increase I the y emittance. These results are in good
agreement with the TOPKARK simulations.
After completion of the initial beamline characterization we replaced the emittance scanner diagnostic in the downstream diagnostic box with a water cooled target holder for CDS prototype target testing. The generic structure of the CDS targets consists of a 1 m thick layer of C deposited on approximately 15 to 20 m of Au which is deposited on a suitable substrate material, such as Cu to provide structural rigidity. Theses targets must withstand peak power densities of approximately 40 kW/cm2 for up to 600 us.
In order to investigate the target survivability we have designed a radiometric surface temperature measurement device for probing the surface temperature rise during the beam pulse. The surface temperature measurement is made by measurement of the surface radiance emission at a known or characterized surface emissivity through application of the Planck law relating object temperature to its optical emission characteristics.
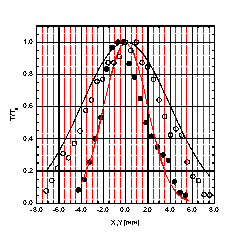
The radiometric measurement spot size is defined by a series of variable apertures installed in the device. With a 0.33 mm aperture the device resolution is 0.5 mm. The radiometric surface temperature profile measured at 10 mA beam on target at 1.76 MeV is shown in fig. 6. The beam distribution has xrms = 1.95 mm, and yrms = 3.1 mm. The spot size can be adjusted by varying the emq's in the HEBT.
For a gaussian beam the peak power density for the beam in fig. 6 is 46.4 kW/cm2, and the average power density at a 95 % beam threshold is 14.8 kW/cm2.
[1] M. Cole, S. Melnychuk, Y. Ng, R. Schmidt,"Status of the 1.76 MeV Pulsed Beamline at the Northrop Grumman Advanced Technology and Development Center" submitted to this conference.
[2] J. J. Sredniawski, "A Contraband detection Proof of Principle Device Using Electrostatic Acceleration" submitted to this conference.
[3] D. L. Bruwiler, M. F. Reusch in Comp. Accel. Phys. , AIP Conf. Proc. 297, Editor: R. Ryne (AIP, New York 19993) p 524.