T. W. Debiak, Y. Ng, J. Sredniawski, and W. Stasi
Advanced Technology and Development Center, Northrop Grumman Corporation
Bethpage, NY 11714-3582 USA
Sweep plate scanners are preferred for emittance measurement due to their versatility, simplicity, and precision. At the Advanced Technology and Development Center of Northrop Grumman, we have routinely used these devices for characterization of injector beams with less than 20 W/cm2 average power density. To characterize higher power beams, like those required for production of tritium or for radioactive waste transmutation, the scanner pod and data collection algorithm must be redesigned due to the possibility of melting the scanner's protective front face or distorting the precision entrance knife edges. Among the methods we have used to mitigate these effects, one consists of drastically reducing the amount of time required for data collection. In this method, the emittance scanner pod traverses the beam in two passes, each requiring less than 0.5 second. In the first pass, the phase space limits of the beam are determined. In the second pass, data is collected primarily within the phase space region limits determined in the first pass. In this way, enough points are collected to assure that the precision of the measurement is high, even though the data collection time for each scan is less than 0.5 second. This paper will describe the layout of the scanner components, the data collection electronics and algorithm, and the data analysis.
To measure the emittance of a particle beam, the angular distribution of the beam particles must be determined as a function of spatial position in the beam. The data are usually displayed in a phase-space graph similar to that shown in Fig. 1.
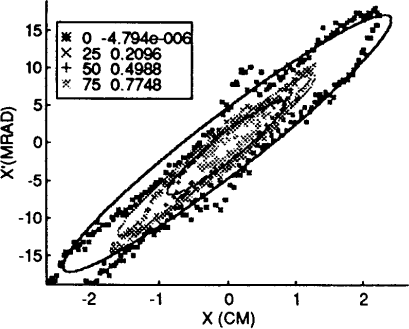
Fig 1. Phase space graph of a particle beam showing the contours corresponding to various beam fractions.
One measure of the beam emittance is the magnitude of the area of the pseudoelliptical space enclosed by the contours shown in Fig. 1. It is usually reported as a function of beam fraction. Using a sweep plate scanner, the angular distribution of the beam particles is determined by noting the electric field at which particles enter a thin aperture at the front of the scanner and exit a thin aperture at the rear of the scanner. The electric field under these conditions is proportional to the beam entrance angle. Knowing the geometry of the scanner and the energy of the beam particles, the angle of the beam particles is easily calculated.
To assure that the whole anguar range of the beam is sampled at all positions, the electric field must be swept to cover the lowest to the highest expected angular limit. The most straightforward method (which is most commonly used) is to sweep through these limits from the beginning position to the final position of data collection. In effect, this means that the total rectangular area of the phase space region in Fig. 1 is sampled in the process of a measurement. This is defined as a "gross scan" in this paper.
The disadvantage of a gross scan is that, for a highly diverging or converging beam, most of the data collection occurs outside of the beam phase space region. Therefore, a large amount of storage is required for a small amount of useful data. This can be mitigated by using a mass storage device during data collection; however, this increases the minimum time necessary to obtain a scan, since these devices are slower than RAM storage. If faster internal RAM memory is used for storage, the maximum amount of data that can be collected in a single scan is limited to the total amount of RAM memory available. Ideally, one would like to use RAM storage to collect data that lies only within the phase space of the beam. This maximizes the data collection efficiency and minimizes the amount of time that the pod is in the beam.
This paper will describe a technique that accomplishes this objective in two steps. In the first step, a gross scan is obtained and stored in RAM memory. The approximate angular limits, position limits, and maximum spread in the angular distribution at a constant position are obtained from the scan. The two extreme angular and position limit coordinates define a straight line that connects the two ends of the phase space. The maximum angular spread of any scan defines the deflection plate voltage change that must be applied at any single position. This defines a parallelogram that encloses the beam phase space. In the second step, data is collected only within this parallelogram. The mean deflection plate voltage is changed in steps as the scan progresses from the beginning position to the end position while the deflection plate voltage spread within a sweep is held constant. In this paper, this is defined as a "detailed scan". A detailed scan maximizes the data collection efficiency, producing the highest point sampling density for the amount of RAM memory available for storage.
The sweep plate scanner is designed to be used for emittance measurement of beams with a power density up to 12.7 kW/cm2. According to the thermal analysis[1], this will require that the scanner traverse the particle beam in a time period of 0.5 second or less. Therefore, the commonly used technique of stepping the scanner through the beam and collecting data during each step will take far too much time. The scanner must move through the beam continuously and quickly. The deflection plate voltage must be applied in a continuous triangle waveform and data collection must be continuous during the scan. This is accomplished by using two waveform generators. The first defines a DC voltage that is applied in steps. The second defines a triangle waveform that is not changed during a scan. Adding these waveforms produces a triangle waveform with an offset that changes in steps from position to position. When this waveform is synchronized with the movement of the pod, continuous data collection, primarily within the limits of the phase space, is accomplished in a time period of 0.5 second or less.
A functional diagram of the emittance scanner pod and electronics is shown in Fig. 2.
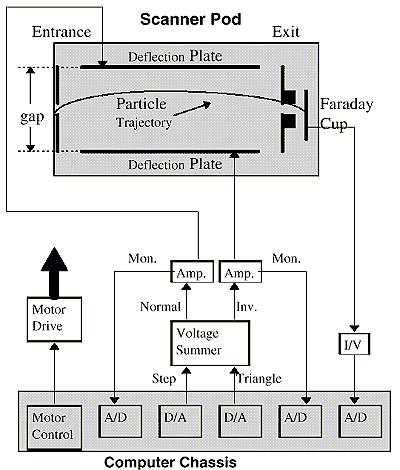
Fig. 2. Emittance scanner pod and electronics functional diagram
Two emittance scanner pods have been constructed, one for a beam energy up to 100 keV and another for a beam energy up to 2 MeV. The primary difference in the two pods is the deflection plate separation. The lower energy scanner has a deflection plate gap of 1.4 cm while the higher energy scanner has a gap of 0.35 cm. Table 1 shows a comparison of the critical scanner properties in each configuration.
Table 1. Critical properties for two scanner designs
| gap (cm) |
(mrad) |
V max (Volts) |
V/ (V/mrad) |
(mrad) |
|
| 100 keV | 1.4 | 18.1 | 0.15 | ||
| 2 MeV | 0.35 | 90.3 | 0.15 |
A rack-mounted computer chassis houses the two waveform generators (D/A) used to produce the composite deflection plate voltage, the three A/D modules, a trigger (not shown), a DC bias voltage supply for the Faraday cup (not shown), and a stepper motor controller. An in-house built current to voltage converter (I/V) translates the Faraday cup current into a voltage that is digitized in one of the three A/D's. The voltage summer is another in-house built electronic module. The input to the summer comes from the two waveform generators. The summer has two outputs: the first is the sum of the two input voltages and the second is the inverse sum. They are independently amplified and applied to the two deflection plates. Using this scheme assures that the region of zero potential is near the entrance slit and exit slit of the scanner pod to assure that the two "field-free" regions have minimum electric field. The two amplifiers have separate outputs that are fed into the remaining two A/D's for monitoring and recording. The movement of the pod across the beam is controlled by the stepper-motor drive controller. The speed can be as high as 30 cm/sec after acceleration. The position of the pod is inferred from the A/D data stream. The A/D data collection speed can be as high as 125,000 conversions/second. This is combined with the known speed of the pod to obtain the position of the pod at any point in the scan. Absolute position resolution is estimated to be 1 mm; however, relative position resolution at 125.000 conversions per second and 30 cm/sec is 2.4 µm.
Sample Faraday cup signals and deflection plate voltages from a partial gross scan and from a partial detailed scan are shown in Figs. 4a and 4b.
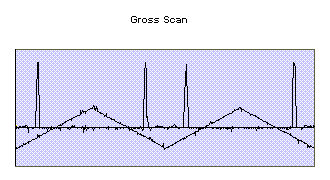
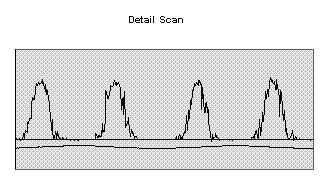
Fig. 4. Faraday cup and corresponding composite deflection plate signals from a portion of a gross scan (a) and from a detailed scan.(b).
Table 2 shows the data collection statistics corresponding to these two partial scans.
Table 2.
| mrad/sec | % of points in phase space |
|
| Gross Scan | 28,000 | 6.9% |
| Detailed Scan | 4,000 | 58% |
The improvement in the fraction of useful data points in a detailed scan is clearly seen. The results of an analysis to obtain the emittance for the detailed scan are shown in Fig. 5. (See Ref. [2].)
For high-power CW and DC particle beams, emittance data collection time must be significantly reduced to prevent melting of the components of the emittance scanner pod. This was accomplished with a sweep plate scanner by taking data continuously as the pod moves through the beam at speeds up to 30 cm/sec. The data collection efficiency was optimized by first obtaining the parallelogram that encloses the phase space, and then collecting data primarily within that parallelogram. For a typical partial scan, 221 total useful points were obtained out of 384 total points, with the number of angular points per position ranging from 7 to 48.
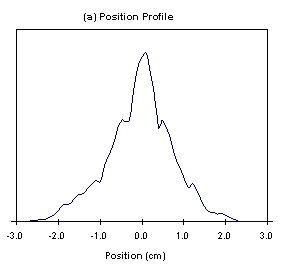
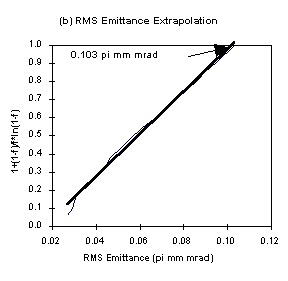
Fig. 5. (a) Position profile, and (b) extrapolation of rms emittance to 100% beam fraction (f)
[1] J. Rathke, M. Peacock, and J. Sredniawski, "Thermo-Mechanical Design of a CW Sweep-Plate Emittance Scanner", Paper TUP47 - this conference
[2] Paul Allison, "Test of Emittance Analysis Program with Simulated Beam", Los Alamos ATS Technical Note AT-2-ATS-23, Feb. 25, 1986