Norihiko Kamikubota and Kazuro Furukawa
National Laboratory for High Energy Physics (KEK)
1-1 Oho, Tsukuba, Ibaraki 305, Japan
Almost all of the signals of the linac control devices, roughly 6000 bytes in total, are scanned with a one-second interval. The changes are recorded into log files during the linac operation as long as three months. A tool, called 'dev_hist', has been developed in order to display the histories of specified devices from these log files. This tool provides mouse-oriented controls to select a device and a time-window of interest.
The KEK injector-linac has provided 2.5-GeV electron and positron beams to the downstream rings, Photon Factory and TRISTAN. The control system for the linac was replaced by a new one in 1993 [1, 2]. The system comprises: a) 7-8 VME stations running under the OS-9 operating system, b) a few Unix-based servers, and c) a communication network by which computers are connected. So far it has operated successfully [3].
The present control system includes surveillance processes which survey almost all of the signals of the linac control devices at a one-second interval. The total amount of signals is roughly 6000 bytes. The change reports from these processes are recorded into log files.
Since the log files consist of a large bulk of ASCII strings, it is not easy to extract useful information from them. Thus, a tool, called 'dev_hist', has been developed in order to provide an easy-to-use environment to display the histories of specified devices from these log files.
This article describes how log files are created in the section "Processes and log files". In the section "Tool for deivice histories", the components of the tool are presented with some examples for a performance demonstration.
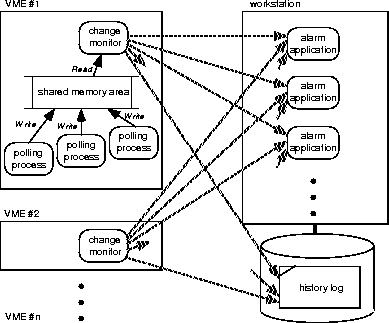
Each VME station has a few (typically 4) field network lines. These field networks have been used to link the distributed device controllers [4]. As shown in Fig. 1, polling processes are running at each VME station. They scan all of the signals of the device controllers, and write them in the shared memory area. The scan rates are set at 1-2 Hz. As a matter of fact, the shared memory area keeps up-to-date values of all the controller signals.

Figure 1: Relations between the processes and logs.
A surveillance process, called "change monitor", surveys the values on the shared memory area with a one-second interval. It creates reports only when changes are detected. The reports from all of the VME stations are collected at a workstation, and are redirected to some alarm applications as well as to log files.
The number of signals with one change monitor in a VME is: a) 440 bytes for eight klystrons and one booster, b) 160-600 bytes for 3-8 power-supply controllers for magnets, c) 60-180 bytes for 1-3 vacuum system controllers, and d) 10-120 bytes of other signals. As a result, the whole system takes care of 6000 bytes of the signals.
The average number of reports during normal operations is 10 per one second. It is also worth noting that the CPU consumption rate by a change monitor is roughly 10% with a 68040 CPU running at 25 MHz.
The reports from the change monitors consist of ASCII strings. They are identified and redirected into appropriate log files, which exist for each device controller.
Fig. 2 shows a part of the log file for the klystron 'K42'.
The first line shows that
the 28-th![]() signal of the klystron
changed from 036b to 04d7 at the time 10:21:08.
The next change of the same data is found in the third line, which shows
that the signal changed to 0634 at 10:21:13.
signal of the klystron
changed from 036b to 04d7 at the time 10:21:08.
The next change of the same data is found in the third line, which shows
that the signal changed to 0634 at 10:21:13.
During the three-month operation from October to December in 1995, the total amount of log files was 1.7 GB. The number of files is about 200, and the largest one has a size of 130 MB.

Figure 2: Example of a history log.
In order to display the histories of linac devices,
a graphic tool, called dev_hist, has been developed.
This tool is
based on a commercial graphic package![]() which provides command-driven interactive functions.
We have developed three essential procedures.
which provides command-driven interactive functions.
We have developed three essential procedures.
The hist_read reads a specified log file and loads the values into internal arrays. Since the sizes of the log files are typically a few MB, and it takes a few minutes to read a file, a special read-in routine was developed with C language instead of using a default read-in procedure. The present read-in times are less than 10 seconds for most cases. It may take a minute when the size is as large as 100 MB.
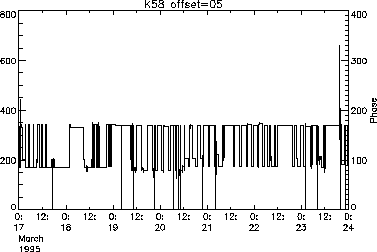
The hist_draw displays a history graph according to the contents of internal arrays. The time-window can be issued in a command-line with keywords. A typical example of a history graph is shown in Fig. 3.

Figure 3: One-week history for the RF phase of the klystron 'K58'.
The dev_hist procedure creates a window with many buttons and menu-bars. A user can select a device and a time-window by clicking buttons/menus with a mouse. The dev_hist invokes the previous two procedures in order to draw a history graph in the drawing area. An overlook of dev_hist is shown in Fig. 4.
Some examples to demonstrate the performance of the tool are presented.
A typical example is already shown in Fig. 3, which shows a one-week history for the RF phase of klystron 'K58'. The phase alternates between 170 degrees and 90 degrees several times. These two values correspond to those for electron and positron injection, respectively. In addition, zero values for very short duration (actually a few seconds) are observed, which implies the occurrences of a self-reset procedure of the klystron controller due to large electro-magnetic noise from the klystron itself.
Fig. 5 is an example with log scaling on the Y-axis. Note that the values of the Y-axis are calculated with pre-defined calibration coefficients. In Fig. 5 the vacuum level of the ion-pump 'IPK3-1' is shown for two weeks. Some obvious peaks, which result from sudden changes in the vacuum to worse, are observed on Tuesdays and in the afternoons of Thursdays. Those originated from the occasional output stops of all the klystrons due to the weekly maintenance every Thursday afternoon and accelerator studies every Tuesday. Each time that we restart the high-power klystrons, it causes immediate changes of the vacuum to a worse condition, followed by gradual changes which make it better.

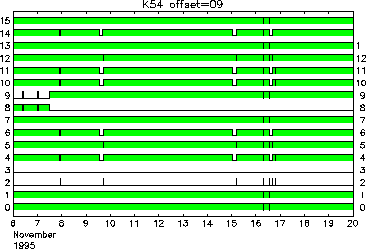
Figure 6: Bit-style display for the logic signals of the klystron 'K54'.
Before the dev_hist became available, only a few members who were very familiar with text-processing tools (i.e. sed, grep, cut, etc.) could extract device histories from the log files. On the contrary, the dev_hist provides everybody possibilities of getting device histories by themselves. The tool is especially useful in cases of troubles, since it has abilities to prove the behaviors of any device at the time of the problem.