The ALS injector linac is used for the Beam Test
Facility (BTF) and the Damping Experiments when it is available
in between the ALS fillings. These experiments usually require
higher quality beams and a better characterization than is normally
required for ALS operations. This paper focuses on the beam emittance,
energy tilt, and especially the longitudinal variation of the
beam parameters. For instance, we want to avoid longitudinal variations
at the low beta section of the BTF. On the other hand, a large
energy tilt is required for post-acceleration compression of the
bunch using an alpha magnet. The PARMELA code was modified to
calculate and display longitudinal variations of the emittance
ellipse. Using the Microsoft Development Studio under Windows
NT environment the code can handle a much larger number of particles
than was previously possible.
The ALS linac was designed in 1986 to serve as a preinjector for the ALS. High charge per bunch was required for fast filling of the storage ring in the few bunch mode. Subharmonic bunchers and an S-band buncher were deployed to achieve this goal. [1] Recently many interesting experiments were proposed in the Beam Test Facility [2] which uses the ALS Linac when it is not used for ALS injection. These experiments may have special requirements for beam parameters and/or require a better characterization of the beam. Good simulation and modeling will help meet these requirements.
A version of the well-known linac code PARMELA adopted for the Windows NT environment was used to model the linac. With the recent hardware and software advances, personal computers now have the attractive speed and memory capacity for doing interesting particle simulations.
The code calculates the motions of macro particles (test particles which are also used for estimating the space charge forces) in 3D under the influence of rf fields and space charge forces. The space charge forces are assumed to be axially symmetric. An older PC version was used by R. Miller, C. Kim, and F. Selph[1] for designing the bunching system for the ALS linac.
The present version is written in FORTRAN 90 and compiled with a 32 bit compiler, Microsoft ® Fortran Power Station. The compiler comes with an excellent debugger. It takes a PC, with a Pentium 133 MHz processor running in double precision, about 1 hour to finish a complete run for modeling the ALS linac with 1,000 test particles, and 10 hours with 10,000 test particles. Test runs with less then 100 particles are useful for adjusting the phases and amplitudes of the various rf systems. These runs take less than ten minutes.
The code runs with a double precision and has the provision of restarting from the particle locations saved from a previous run.
The code saves particle coordinates as they pass through element boundaries and writes to a binary file which can be analyzed with a post-processor PARGRAPH. PARGRAPH calculates emittances and other ellipse parameters and plots some selected two dimensional projections of the electron distribution at a given location.
Run-time graphics similar to the post-processor have been implemented in PARMELA to plot some selected two dimensional projections of the electron distribution at every time step or at a user specified time interval.
Run time graphics are like windows to the code through
which one might peek and see what is going on. It is useful for
debugging the code, and for optimization of designs and operations.

Two subharmonic bunchers, operating at frequencies of 125 MHz and 500 MHz, are used to compress the electron bunch from the gun to the entrance of the S-band buncher. Both the 125 MHz buncher and the 500 MHz buncher consist of re-entrant cavities, and can generate maximum of 45 kV peak including the transit time factor. The S-band buncher is a 10- cm-long 4-cavity traveling-wave waveguide with b=0.75 in 2p/3 mode. The S-band buncher can produce up to 3.5 MV/m accelerating fields.
The Linac has two sections of 2-m traveling-wave structures with b=1 in 2p/3 mode and can produce a maximum accelerating gradient of about 13 MV/m. Frequency of the linac is 2.997924 GHz.
For the nominal operation the 120 keV electron gun
produces about 1 Ampere with a duration of about 2 nsec, and 1
to 4 bunches with a bunch to bunch separation of 8 nsec.
During the initial stages of simulation, optimum parameters for focusing, and rf parameters are searched for which give the maximum beam transfer and the minimum emittance growth. This process is the most time-consuming and labor-intensive part of the simulation and requires insights and persistence. Codes are frequently modified and debugged during this period. Modularizing the code was beneficial during this process.
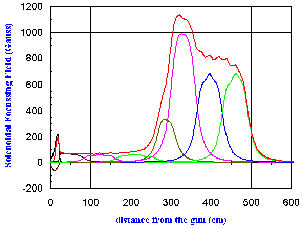
Low energy electrons (<25 MeV) are focused by solenoids to the end of the Linac Section I. The solenoidal fields are calculated individually for each coil using the POISSON code and linearly superimposed for the 8 solenoids as shown in figure 2. Focusing field is increased when the bunch length becomes short and decreased when the beam energy increases.

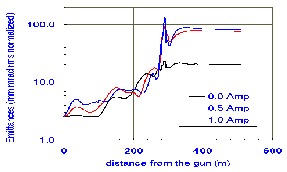
Three simulation results are summarized in table 1 and in Figure 3. The gun current is varied for the configurations which is otherwise the same except the linac phase was slightly changed to compensate for the different time-of-flight. Thus, the magnitude of the space charge effects can be estimated by comparing these runs. The most significant difference between the three runs one can see from table 1 is the beam loss that is occurring in the S-band buncher. One can clearly see the beam blowup by the space charge forces in the run-time- and in the post-processor- graphics. The easiest remedy to improve beam transfer in this region is to shorten the drift distance from the 500 MHz buncher to the beginning of the S-band buncher A simulation with one half the drift distance showed an excellent result.
Results for the 1 Ampere simulation are consistent
with our nominal operation in which we start with 2 nC and accelerate
1 nC of them to 50 MeV.
Table 1. Summary of three simulations. Electron bunch length (pico seconds rms) and the fraction of the remaining electrons at the beginning of each element.
| Element | locat-ion | Bunch length (psec) /
fraction of remaining electrons | ||
| (m) | 0.0 Amp | 0.5 Amp | 1.0 Amp | |
| Electron Gun | 0 | 498 / 1.0 | 498 / 1.0 | 498 / 1.0 |
| 125 MHz Buncher | 100 | 499 / 1.0 | 505 /1.0 | 511 / 1.0 |
| 500 MHz Buncher | 246 | 82 / 1.0 | 124 / 1.0 | 157 / 1.0 |
| S Band Buncher | 278 | 50 / 1.0 | 51 / 1.0 | 58 / 1.0 |
| Linac Section 1 | 290 | 24 / 1.0 | 25 /.84 | 30 /.57 |
| End of Section 1 | 490 | 8 / 1.0 | 9 /.84 | 11 /.57 |
| Quad Triplets | 533-578 | 8 / 1.0 | 10 /.84 | 12 /.57 |
| End of Section 2 | 805 | 8 / 1.0 | 10 /.83 | 12 /.56 |

Most of the emittance growth occurred in the bunching region (z = 100 - 288 cm) as shown in figure 3. Large chromatic effects caused longitudinal variation of emittances and eventual emittance growth in this region.
Space charge effects caused a rapid emittance growth near the S-band buncher (z = 278 -288 cm), but the resulting beam loss caused the emittances to decrease because outlying electrons are preferentially lost. A simulation showed that this type of emittance growth and particle loss can be reduced significantly by decreasing the drift distance from the 500 MHz to the beginning of the S-band buncher by a factor of 2.
Figure 4 shows the phase space distribution of electrons
at the final energy of 50 MeV. Out of the initial 2.0 nC, 1.1
nC are accelerated to this energy. The electron distributions
in the X - X' and E - f phase
space are shown in figure 4. The sine-wave foot-print in the longitudinal
distribution is obviously made by the accelerating rf field. The
linac parameters corresponding to this run have not been optimized
but just represent a set of self consistent beam parameters which
we are going to use for further analysis. For instance the rf
phase of the linac section 2 was lagging by about 10 degrees behind
which produced an energy tilt as shown in figure 4.

Average beam parameters at the final energy are summarized
in table 2. These parameters were calculated by the post processor.
| Charge per Bunch
Beam Energy emitt x rms unnorm emitt y rms unnorm emitt z rms unnorm Xrms Yrms X'rms, Y'rms pulse length alpha x alpha y beta x beta y | 1.1
51 0.95 1.0 24 3.99 3.90 0.45 11.5 -1.6 -1.4 16.8 15.2 | nC
MeV mm mrad mm mrad MeV deg mm mm mRad
deg m m |
Table 2. Beam parameters at the final energy
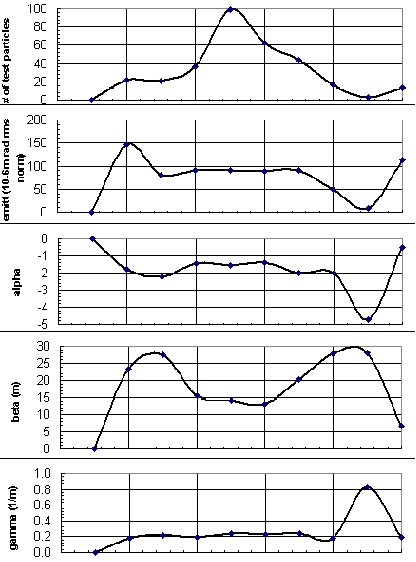
The post processor was modified to calculate the longitudinal variation of the beam parameters. The beam is cut into 10 longitudinal sections where 1 section is 1 sigma long. Number of electrons in each section is counted and the same set of beam parameters as shown in table 2 are calculated for each section. Some of these parameters are plotted in figure 5.
The longitudinal variation of the ellipse parameters are quite flat over the central 4 sigma region and generally weaker then that of the bunching region (not shown in this paper).

The author wishes to thank Mr. Alan Jackson for reading
the manuscript carefully and made valuable suggestions.
[1] R. Miller, C. Kim, F. Selph, "Design of a Bunching System For a High-Intensity Electron Linac", Proceedings of the European Particle Accelerator Conference, Rome, June 7-11, 1988, page 863
[2]W. Leemans, G. Behrsing, K.-J. Kim, J. Krupnick,
C. Matuk, F. Selph, and C. Chattopadhyay, "The 50 MeV Beam
Test Facility at LBL", Proceedings of the Particle Accelerator
Conference, Washington, D. C., May 17 - 20, 1993, Page 83