The wake field effects in accelerator sections for future linear colliders will be reduced either by damping, by detuning or a combination of both. In the case of the DESY S-band test linac it is foreseen to employ two HOM damped cells within a detuned stack of undamped ones. In order to obtain optimal performance by use of single cell dampers a design was derived by applying numerical tools. To understand the behaviour of such a damper cell in a detuned structure, a damper cell was build and inserted in a strongly detuned 36-cell S-band structure. This structure was investigated experimentally by perturbation measurements.
The S-Band 500GeV Linear Collider Study SBLC foresees about 5000 constant-gradient (cg) acceleration structures of 180 cells with a loaded gradient of 17 MV/m. It considers a bunch train of 333 bunches with a spacing of 6ns from bunch to bunch. To achieve a high luminosity any cumulative beam break-up along the bunch train has to be avoided. Wakefield effects driven by HOMs are one of the primary sources of emittance growth. Consequently, the suppression of these HOMs is a very crucial point in all actual linear collider designs. The major interest of calculations was focussed on the modes of the first dipole band since they cause the severest deflecting effects, but also the 3rd and 6th dipole passband need to be studied.
Calculations for the SBLC structure were carried out with ORTHO [1] for a somewhat simplified 180-cell structure with 30 landings. One of the main results was that not only the first pi-like dipole modes influence the beam dynamics but about 140 modes! A major part of these deflecting modes is trapped inside the cg structure, that is without contact to the end cells.
Since the phenomenon of trapped HOMs in tapered waveguides was neither theoretically nor experimentally well known and has a strong influence on the design of damping schemes further HOM investigations have been started: A test structure was designed with the goal to have a structure which is easy to measure, easy to manufacture, which is computable with different numerical methods (MAFIA, URMEL-T, ORTHO, COM) without geometric approximations, and which shows the clear appearance of trapped modes.
Performing RF-measurements on long structures is severely limited by the appearance of mode overlap. Therefore a relatively short structure had to be chosen. In order to get a both mechanically and thermally stable structure a massive design was chosen. For low mechanical tolerances a simple geometry was designed. The structure has a very strong linear tapering of the iris, constant outer radius and twice as thick irisses as the original SBLC structure. Comparisons of numerical calculations and measurements [2] gave a good agreement in resonance frequencies and the field distribution. Further the clear appearance of trapped modes was found for several modes.
The structure, made of standard OFHC copper, consists
of 36 cells clamped together by truss rods. Overall length is
1450mm, cut-off pipes of 100mm length are attached to each end
of the structure. The cell geometry is similar to the one chosen
for the SBLC, except for the iris thickness which is 10mm instead
of 5mm. The iris openings were evenly tapered from 40mm dia-meter
at the beginning to 20mm at the end.

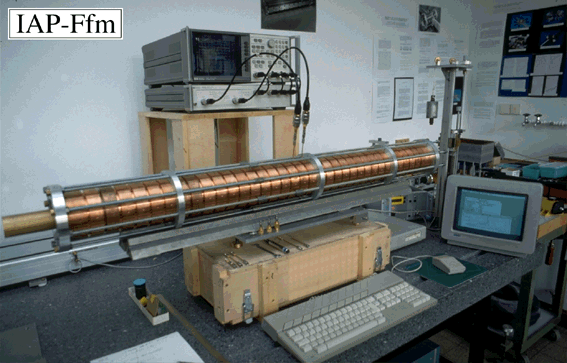
For the measurements of the damped structure we have inserted a sheet of paper covered with graphite in cell #18 (see Fig. 1). This damping material could be inserted without demounting of the structure. It is only a model for test purpose that represents a damping unit like a wall slotted cell with four rectangular waveguides attached. This method avoids the influence of changed electrical contacts due to the reassembling on the measured Q-values. Proper alignment is ensured by laying the structure on top of an optical bench. The field measurements were performed using a modified nonresonant bead pull technique [3], [4], [5]. Data is taken by a HP8719c network analyser for 801 discrete positions along several paths parallel to the cavity axis. In Fig. 2 a picture of the test setup is shown.
The method applied is a variant of the nonresonant
beadpull technique as described elsewhere [6].
In the measurements we are only interested in the longitudinal
component of the electric field, because it is sufficient to indicate
the effect of the damper cell. Thus we used a dielectric needle
(Al2O3, epsilon r=9.2) as bead. This ceramic bead was 6mm long
and 1mm in diameter. A lumped circuit representation of the resonator
combined with Slater's formula [7] leads to
the electric field:
 (1)
(1)
For the measurements the bead was calibrated in a
TM010-pillbox for the longitudinal perturbation constant (alpha=9.34E-20
Asm2/V). Since the measured modes were of dipole type
the bead pull measurements were performed off-axis with a distance
of 7mm to the structure axis. For the measurements we have chosen
several modes of the first dipole passband which have significant
field strength at the damper position (cell #18) since a considerable
damping effect could only be expected in this case.
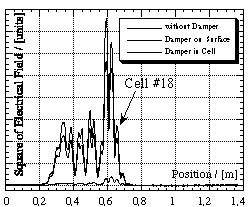
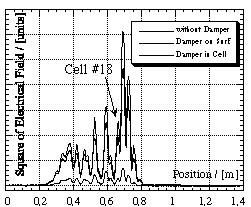
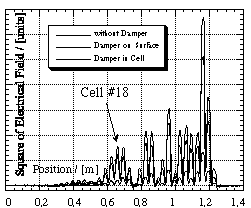
In a tapered structure trapped modes always change their phase shift from cell to cell from 0 to pi. To investigate the influence of the damper position, we have chosen mode A with the pi-end, mode B with the pi/2-part and mode C with the 0-end at the damper position.
As mentioned above, the damper was realized by a sheet of paper covered with graphite (thickness 1.5um, conductance of graphite = 1.25E5 1/Ohm*m). First the sheet was pressed to the inner wall of cell #18 in order to have a symmetric damper and relatively weak damping effect (damper on surface). Additionally the damping effect was increased by moving the sheet some mm towards the iris, since the electrical field increases in this direction (damper in cell).
The following pictures (see Fig. 3,
Fig. 4 and Fig. 5) show
the measured mode geometry without damping, weak damping and strong
damping.
The following table contains the results of the measurements in detail:
| measurement results | on surface | in cell | ||
| frequency [GHz] | ||||
| unloaded Q0 | 10,400 | 8,900 | 1,500 | |
| damping effect | 1.000 | 0.778 | 0.045 | |
| long.shuntimp.[MOhm] | 6.43 | 5.00 | 0.92 | |
| frequency [GHz] | ||||
| unloaded Q0 | 10,500 | 9,000 | 3,200 | |
| damping effect | 1.000 | 0.815 | 0.172 | |
| long.shuntimp.[MOhm] | 11.32 | 10.74 | 3.80 | |
| frequency [GHz] | ||||
| unloaded Q0 | 12,100 | 10,800 | 4,400 | |
| damping effect | 1.000 | 0.731 | 0.183 | |
| long.shuntimp.[MOhm] | 11.73 | 7.63 | 3.26 |
The next Picture (see Fig. 6)
shows that the damping effect is evenly distributed over all phases
of the modes.
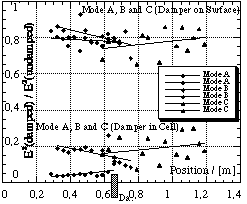
From former measurements a strong influence on mode geometry was expected [8]. But as can bee seen in Fig. 6 weak damping as well as strong damping has not changed the mode geometry significantly. The damping effect is even distributed over all phase shifts.
Here we have to mention, that no damping effect could be expected, if the mode has no energy at the location of the damper. Further investigations concerning the interaction between mode energy in the damped cell and damping effect are planned. Additionally we intend to investigate the effect of several damper cells grouped together or distributed over the structure.
Numerical calculations with the program MAFIA concerning the damped 36-cell structure are in preparation.
[1] U. van Rienen: "Higher Order Mode Analysis of Tapered Disc-Loaded Waveguides using the Mode Matching Technique", Particle Accelerators, Vol. 41, pp. 173 - 201, 1993
[2] M. Kurz et al.: "Higher-Order Modes in a 36-Cell Test Structure", 5th EPAC, Barcelona, 1996
[3] C.W. Steele: "A Nonresonant Perturbation Theory", IEEE Trans. MTT-14 (2), pp. 70-74, 1966
[4] P. Hülsmann, M. Kurz, H. Klein: "Experimental Determination of Field Strength and Quality Factor of heavily damped Accelerator Cavities", Electronics Letters, Vol. 27 No. 19, pp. 1727-1729, 12.09.1991
[5] M. Kurz: "Untersuchungen zu mikrowellenfokussierenden Beschleunigerstrukturen für zukünftige lineare Collider", thesis, Frankfurt, 1993
[6] B. Krietenstein et al.: "The S-Band 36-Cell Experiment", Particle Accelerator Conference and International Conference on High-Energy Accelerators, Dallas (Texas), 1995