Low energy beam transport
(LEBT) of high perveance ion beams suffers from high space charge
forces. Space charge compensation reduces the necessary focusing
force of the lenses and the radius of the beam in the lenses and
therefrom the emittance growth due to aberrations and self fields.
The use of electrostatic lenses is restricted due to decompensation
by the electric fields. On the other side magnetic lenses suffer,
for high mass ions, from the necessary high magnetic fields and
the resulting technical problems. A different approach for LEBT
is a lens using a static non neutral plasma confined in a magnetic
and electrostatic field configuration allowing strong electrostatic
focusing with only small influence on space charge compensation.
Modeling of the plasma in respect to low lens aberrations is very
difficult and there is no closed theory available. New measurements
at low residual gas pressure as well as theoretical work will
be discussed.
For prediction of the transport
capabilities of a low energy transport line using compensated
transport it is necessary to know the density distributions of
the compensating particles and the beam particles. So far
the distribution of the compensating particles can only be calculated
in a selfconsistent way, in a drift region [1,2,3]. This is not
possible inside magnetic structures now. The theory for determination
of the electron density (for positive ions) in compensated transport
might benefit from the theory of charge density distribution in
a Gabor plasma lens (GPL) where the electron enclosure is performed
by magnetic and electrostatic fields. The advantages of a Gabor
lens for measurements are higher electron densities and therefore
enhanced influence on the beam. Therefore solving the density
distribution problem for the GPL might be a step forward for description
of compensated transport. An indication therefore give [4,5] where
some aberrations in compensated transport are explained by a high
electron density on axis. Apart from the forecast of self fields
in compensated transport the GPL is still a very promising candidate
for a LEBT line.
The theory of electron density in a Gabor lens was originally given by [6]. The maximum density is only determined by the (homogeneous) magnetic field and given by
Other studies [7,8] assume that the focal strength of a Gabor lens is linear with the applied electric potential of the center electrode. Results of numerical calculations using eq. (1) for the radial electron enclosure density and a Poisson solver for the longitudinal confinement by the electrode potential assuming a homogeneous filled cylinder of 106 mm length and 35 mm diameter (this is the free space inside the Frankfurt Gabor lens) is shown in fig. 1. The maximum electron density is a function of the free external field parameters. This calculated theoretical maximum density might not be reached in an experiment. Furthermore a homogeneous density distribution was assumed which has to be proven experimentally.

Fig. 1: Theoretical maximum electron density in a Gabor lens as a function of the external fields
Two experiments have been
set up. One for determination of the electron density by examination
of the light emitted by the plasma. This radiation is produced
by collisions between the residual gas and the captured electrons.
A second experiment was set up to measure the focusing
capabilities of the GPL using a 10 keV He+ beam. The results will
be compared with numerical simulations.
Density measurements
The set up for the measurement
of the radial density distribution is shown in fig. 2. The GPL
was mounted on a turbo molecular pump with an adjustable valve
for residual gas pressure control. The plasma is produced by a
gas discharge below the Paschen limit. The emitted light was measured
by a CCD camera installed on top of the lens. Therefore the measured
light intensity is integrated along the z axis. The results are
used to determine the electron density distribution. The pressure
was adjusted to be comparable to the beam experiments. Helium,
argon and hydrogen where used as residual gas.
Beam measurements
The set up for the measurement of the focusing capabilities is shown in fig. 3. The ion beam (He+, 10 keV, 4 mA, DC, p = 7*10-5 hPa) was extracted from a HIEFS [9] like ion source and a parallel beam of app. 40 mm diameter at the entrance of the Gabor lens was formed by the LEBT consisting of two solenoids. The Gabor lens was followed by a diagnostic tank (profile, beam potential and emittance measurements).

Fig. 2: Experimental set up
for the measurement of the light.

Fig. 3: Experimental set up for beam measurement.
Density measurements

Fig. 4: Intensity of the emitted light as a function of x and y for a CCD exposure time of 5 s and a lens potential of 3 kV and magnetic field strength of 105 G.

Fig. 5: Radial density distribution of the emitted light as a function of the electrode potential for a fixed magnetic field of 105 G.

Fig. 6: Radial density distribution of the emitted light as a function of the magnetic field for a fixed lens potential of 3 kV.


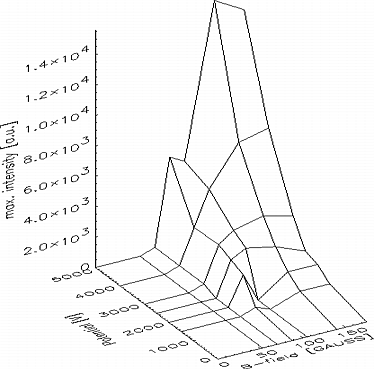
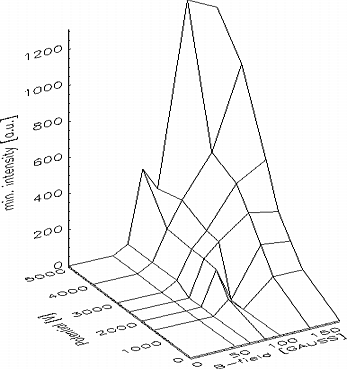
Fig. 7: Maximum and minimum intensity of the emitted light as a function of the electric and magnetic field.
Fig. 4 shows a result of a light intensity measurement. The intensity of the emitted light is strongly peaked on the lens axis and therefrom the electron density is assumed to be distributed in a similar way. In fig. 5 the radial light intensity distribution is shown as a function of the potential on the center electrode, the form of the radial density distribution seems to be constant and the height growths linear in a first approximation except for the lowest fields where the gas discharge is off. In fig. 6 the light intensity is shown as a function of the external field. The intensity rises more than linear for low fields and then levels off. In fig. 7 the maximum (upper graph) and the minimum (lower graph) light intensity of the profiles is shown as a function of the external parameters electrode potential and magnetic field strength. The contour of these light intensity plots are similar to the pattern of the theoretical expected maximum electron densities (fig. 1).

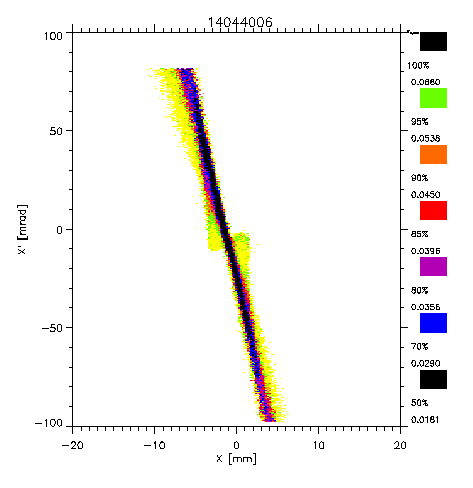
Fig. 8: Emittance behind the not active lens.

Fig. 9: Emittance behind the
lens for 3 kV potential and B=66 Gauss.

Fig. 10: Reconstructed input emittance (in front of the lens) for numerical simulation of the transport properties of the lens.
Beam measurements
The results of the emittance
measurements behind the Gabor lens are shown in fig. 8 and 9.
Fig. 8 shows the emittance with the lens off, fig. 9 with
the lens in operation. Fig. 10 - 12 show numerical calculations
of the transport capabilities of the lens. In fig. 10 the emittance
in front of the lens is shown. This was calculated from the measured
emittance behind the lens (fig. 8) using 250 beams and neglecting
the space charge of the beam (degree of compensation in the measurements
was >> 90 %). Fig. 11 shows the result of a transport calculation
for operational lens starting with this emittance (fig.10). A
homogeneous electron density distribution calculated from the
radial limitation criteria for the lens (![]() e
= 38*10-6 As/m3) was assumed. The beam space charge was neglected.
Fig. 12 shows the result of a transport calculation using the
'peaked' electron distribution from the CCD measurements scaled
to the same density in the maximum (
e
= 38*10-6 As/m3) was assumed. The beam space charge was neglected.
Fig. 12 shows the result of a transport calculation using the
'peaked' electron distribution from the CCD measurements scaled
to the same density in the maximum (![]() emax
=38*10-6 As/m3 ).
emax
=38*10-6 As/m3 ).

Fig. 11: Numerical simulation of the emittance behind the lens under the assumption of homogeneous distributed electrons.

Fig. 12: Like fig. 11 under assumption of peaked electron distribution.
Comparison between the measured
emittance and the calculated emittances show in focusing strength
and in aberration forecast a better result for the peaked than
for the homogeneous distribution. Nevertheless the experiments
indicate that the electron density is between these two cases.
This could be explained by additional electrons produced by the
beam traveling through the lens and the influence of the beam
potential on the plasma. The principle for the electron concentration
on the axis is unknown. Therefore theoretical work using selfconsistent
density distributions for the thermalized electrons will be done.
[1] J. Pozimski et. al. GSI-Annual Report 1992, GSI-93-17, p. 38-40
[2] J. Pozimski et. al. Proc. Frascati 1993
[3] R. Dölling, Dissertation, Institut für Angewandte Physik, Univ. Frankfurt (1994)
[4] P. Groß et. al., Proc. LINAC Conf. 1994, Tsukuba
[5] P. Groß, Dissertation in preparation, Institut für Angewandte Physik, Univ. Frankfurt (1996)
[6] D. Gabor, Nature 160 (1947) 89
[7] J. A. Palkovic et. al. Proc. LINAC Conf. 1988, Williamsburg/VA
[8] R. M. Mobley, Brookh. National Lab., BNL-25173 (1973)
[9] K. Volk, Dissertation, Institut für Angewandte Physik, Univ. Frankfurt(1993)
[10] J. Pozimski et. al. GSI-Annual
Report 1994, GSI-95-06,p. 32-34
We thank L. Wicke and Dr.
M. Sarstedt from the IAP for the use of the CCD camera.
* Work supported by BMBF (contract 060F359)